Modern office concepts
2026-11-12
Strategically planning office space: Why good space planning begins with valid data
In short: If you are planning a new office, you should measure first and decide later. Booking data shows how your space is actually used today, while sensors supplement this with actual occupancy. In this article, you will learn which evaluations matter and what preparatory work should precede any space planning.

Table of contents
A new location, an expiring lease, a conversion to a hybrid office: decisions about office space are among the most expensive and long-term commitments a company makes. Nevertheless, they are surprisingly often based on assumptions. "There are usually two of us in the office," "Tuesdays are always busy," "We need more meeting rooms." This sounds plausible, but rarely stands up to scrutiny. If you want to plan office space strategically, you need one thing above all: reliable data on how the current space is actually being used.
Space planning based on gut feeling: The risk in the hybrid office
Since hybrid work has become the standard, there is no longer a "normal" office day. Many desks sit empty on Mondays and Fridays, while things get crowded on team days. Some departments come in almost daily, others hardly at all. Meeting rooms for twelve people are occupied by two, while phone booths are constantly booked out. Therefore, headcount alone no longer says much about actual space requirements.
Planning a new office without usage data is like tailoring a suit without a tape measure. In the end, it might fit somehow, but rarely where it counts. And unlike a suit, office space cannot simply be exchanged: leases often run for many years, and renovations tie up budget and time.
The consequences of poor planning are expensive in both directions. If the space is too large, you pay rent, energy, and cleaning costs for empty desks. If it is too small, there are not enough desks on peak days, teams are torn apart, and acceptance of the new office drops before it has even really arrived.
More than just space reservation: What booking data reveals about your office
A desk sharing software is usually introduced to organize everyday office life: booking a workstation, reserving a meeting room, securing a parking space. But with every booking, a picture of how your company really works emerges on the side. The longer the software is in use, the more meaningful this picture becomes. Typical practical insights include, for example:
- How many workstations were actually occupied on the ten busiest days of the year, and how far this value deviates from the daily average.
- Whether large conference rooms are predominantly booked by small groups and could actually provide space for several smaller meeting rooms.
- How office presence has changed since a new home office policy or fixed team days were introduced.
- Whether parking spaces are regularly fully booked while workstations remain free, which is an indication that commuting is a bottleneck.
Such correlations are not recognized in day-to-day business, but only in retrospect. This is precisely why historical booking data is so valuable for every space-related decision.
Flexopus: From desk booking to data-driven space planning
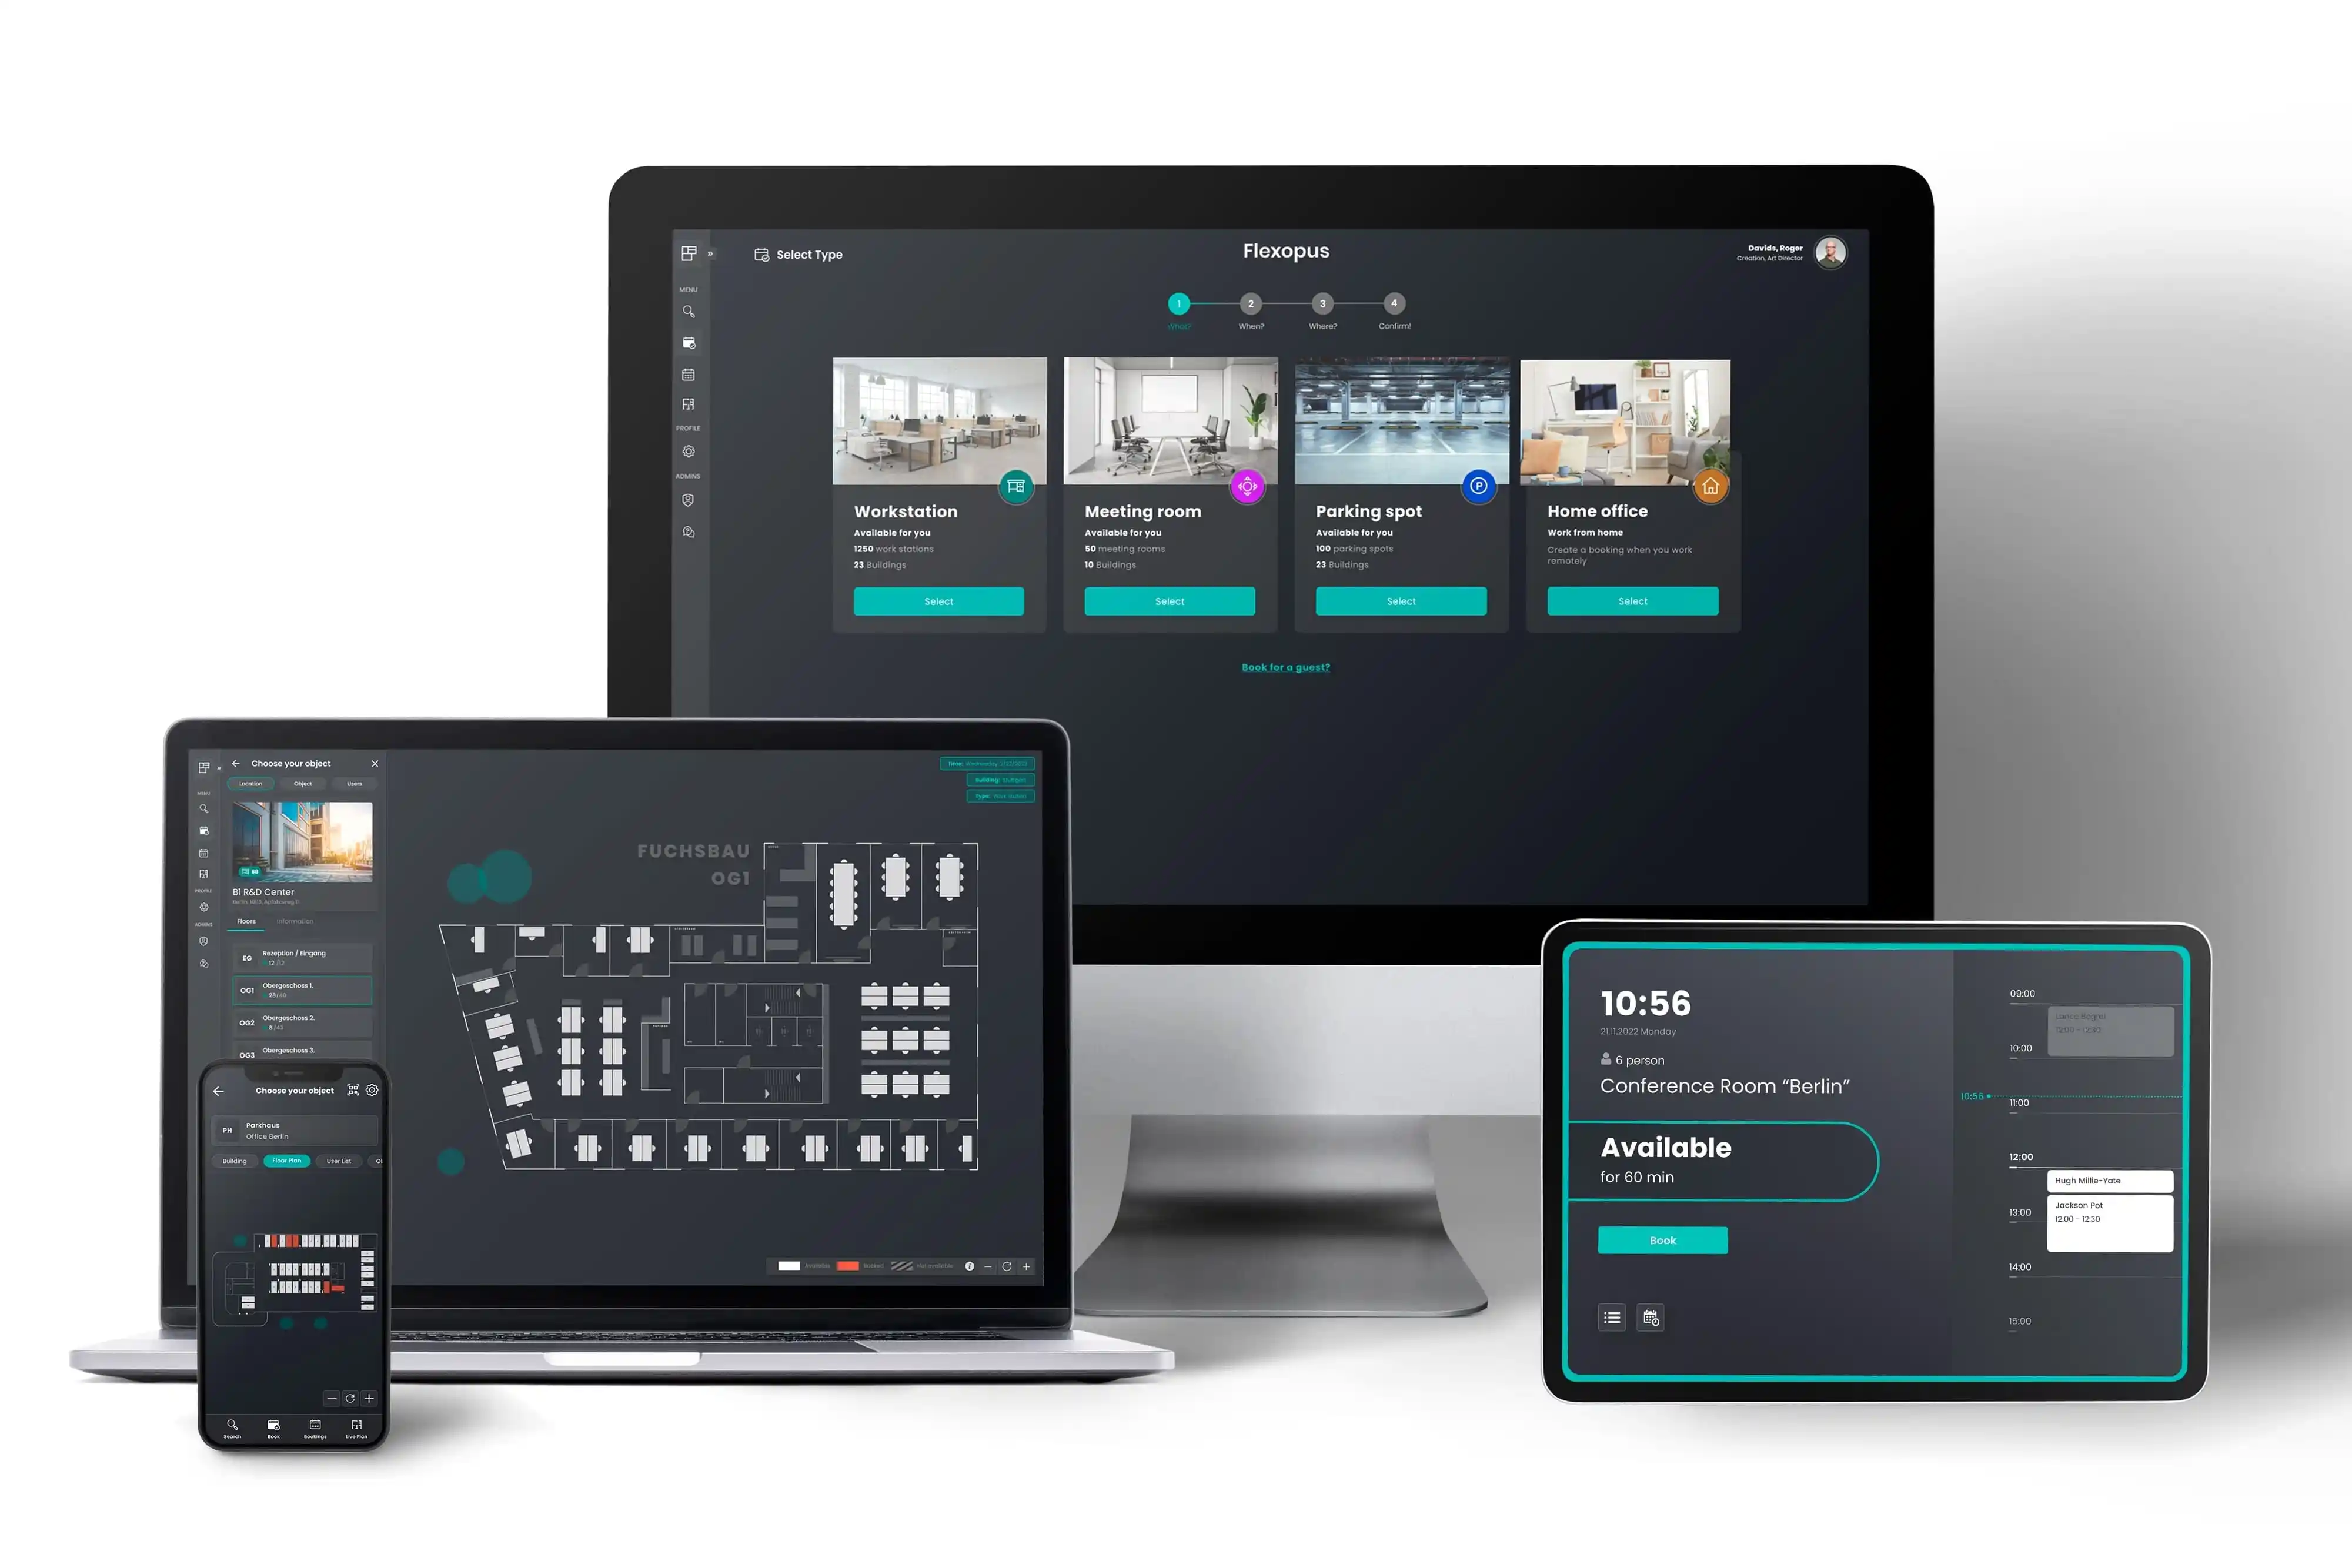
Flexopus is a workplace management software from Stuttgart, with which companies organize their hybrid office. With the desk sharing software, employees book flexible workstations, via the room booking system meeting rooms and via the parking management their parking space, via browser, app, Microsoft Teams or Outlook. The platform is complemented by visitor management software, catering & office services, asset management, room displays as well as workstation and room sensors. Over 80 integrations, including Microsoft 365, Google Workspace, and common HR systems, connect Flexopus to existing workflows. The software is hosted in Germany, is GDPR-compliant, and is already in use in over 4,000 offices.
Booking data: The data foundation that is often already available
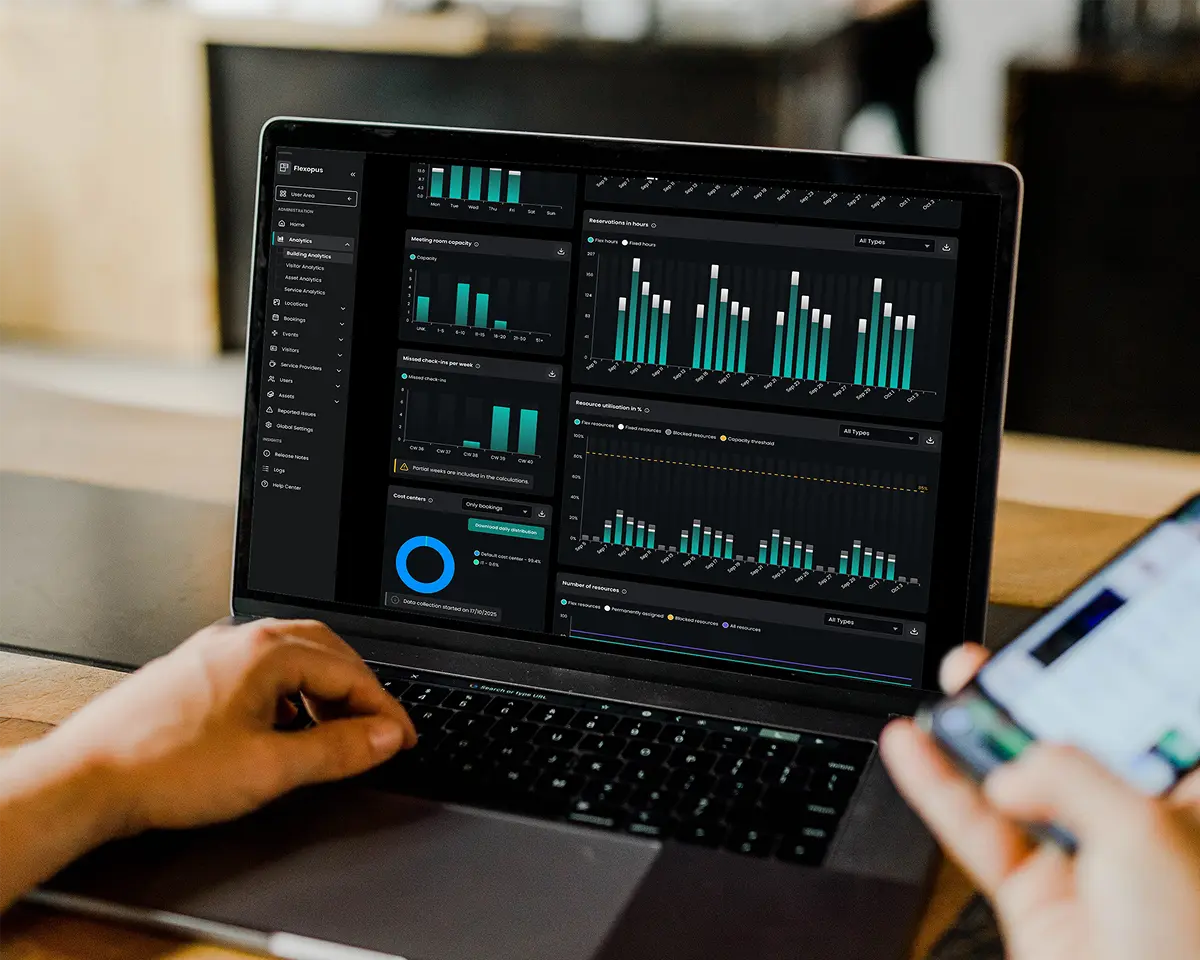
Companies that use Flexopus are often already sitting on this treasure trove of data. In the Smart Analytics Dashboard, the data is processed. The following evaluations are particularly relevant for space planning:
- Utilization by building and floor: Which locations and areas are in demand, and which remain permanently empty?
- Peak times by day of the week and time: The time heatmap shows exactly when the office reaches its capacity limits, hour by hour.
- Heatmap on the floor plan: Popular and avoided spots become visible at a glance, such as window seats versus seats in high-traffic areas.
- Flex, fixed, and blocked seats over time: From this, the desk-sharing ratio can be calculated directly: booked seats divided by bookable seats.
- Meeting room capacities by size: Which room sizes are actually needed?
- Check-in rates and expired bookings: How often are seats booked but not used?
For in-depth analysis, all data can be exported as a CSV or transferred via REST API to tools like Power BI or Tableau. Important for works councils and data protection: In its standard configuration, Flexopus does not analyze personal data, but only data at the resource level.
Booking is not the same as usage: Sensors close the data gap
As valuable as booking data is, it only shows what was planned, not what actually happened. A desk is booked but not used. Another is occupied spontaneously without a booking. A meeting room is reserved for two hours, but the meeting ends after twenty minutes. For precise space planning, a second data source is therefore required: actual on-site occupancy.
This is exactly where sensors and IoT devices come into play:
- Workplace sensors use motion and heat detection to determine whether a desk is actually occupied. This makes no-shows, spontaneous usage, and true utilization visible.
- Room sensors use radar and PIR technology to detect whether meeting rooms are actually being used, with an accuracy of up to 99 percent. Multiple sensors can be combined in large rooms.
The sensors operate wirelessly and transmit their data to Flexopus in near real-time via a dedicated gateway, without requiring a connection to the company Wi-Fi. Depending on the configuration, the batteries last for two to four years. This makes measurement possible even in existing offices without the need for renovations.
Only by comparing both sources can you get the full picture: booking data shows the planned demand, while sensor data shows the lived reality.
This preparatory work should precede any space planning

Anyone looking to plan office space strategically should go through these steps before the first floor plan for a new location is created:
1. Record the current state: How many workstations, meeting rooms, focus rooms, and special areas exist today? A digital floor plan of all levels is the foundation for any further analysis.
2. Choose a meaningful measurement period: A snapshot can be misleading. Vacation periods, the end of a quarter, or a major project significantly change occupancy. Therefore, plan using data from several months, ideally a full year. If you do not yet have a booking history, start measuring now and supplement it with sensors from the very beginning.
3. Clarify who sits where: Which teams work closely together, and which departments come in on which days? Group management in Flexopus makes team structures visible in the data and helps plan logical neighborhoods for the new office.
4. Analyze peak load and average values separately: An average utilization of 45 percent does not mean that half the space is sufficient. The decisive factor is how often and how significantly occupancy spikes, and whether these peaks can be smoothed out through coordinated team days.
5. Derive space requirements based on activities: Which room sizes are actually being used? It often turns out that instead of large conference rooms, there is a greater need for small meeting rooms, phone booths, and collaboration areas.
6. Involve employees: Data shows how space is used, but not why. Surveys and workshops supplement the numbers with needs that are not yet reflected, such as a lack of quiet zones for focused work.
7. Consider the future: Growth plans, changes in working from home reegulations or new locations must be incorporated into the planning. Today's data is the starting point, not the destination.
8. Involve the works council and data protection officers early on: Usage measurement only works with trust. Anonymous evaluations at the resource level and transparent communication create the necessary acceptance.
From data analysis to the right desk-sharing ratio
A simplified calculation example shows how data changes planning: A company with 200 employees is planning a new office. Without data, one might provide 200 workstations, or perhaps a flat 120, "because many people are working from home." However, measurements show that on average, 85 people are on-site, with 130 on peak days. Sensor data also reveals that around 15 percent of bookings are not actually used.
With these figures, you can make well-founded decisions: Do you plan for peak capacity, or do you manage peak days through team-day concepts and the automatic release of unused bookings via check-in? Which desk-sharing ratio suits the company? And how much of the saved space should be invested in collaboration areas that make the office more attractive? Or how much space can potentially even be sublet? These are strategic decisions, but they are based on facts rather than assumptions.
Conclusion: No new office without reliable data
Strategic space planning does not begin with the floor plan, but with analysis. Those who know how many people come and when, where they sit, which rooms they actually use, and where space remains empty can plan an office that fits actual working habits. This saves costs and creates a work environment that people enjoy coming to.
With Flexopus, much of this data is already available through daily desk and room bookings. Supplemented by sensors for workstations and meeting rooms, a data foundation is created that allows you to reliably plan your office space of the future.
The most important questions summarized
Why is the number of employees not enough to plan office space in a hybrid office?

In a hybrid office, there is no longer a "normal" office day: many desks remain empty on Mondays and Fridays, while it gets crowded on team days. Therefore, the number of employees says little about the actual space requirements. Planning based on gut feeling risks errors in both directions: too much space costs rent, energy, and cleaning for empty desks. Too little space leads to a lack of room on peak days, separated teams, and declining acceptance. Since lease agreements often run for many years, such mistakes are difficult to correct.
What data does Flexopus provide for space planning, and why are additional sensors needed?
Flexopus processes booking data in the Smart Analytics Dashboard: utilization by building and floor, peak times via time heatmaps, popular spots on the floor plan, used meeting room sizes, and check-in rates. However, bookings only show what was planned. Sensors for workstations and meeting rooms measure actual occupancy and make no-shows and spontaneous usage visible. Only by combining both sources do you get the complete picture. By default, evaluations are performed at the resource level, not on an individual basis.
How do I find the right desk-sharing ratio for a new office using usage data?
Look at the average and peak load separately and use data from several months, ideally an entire year. For example: With 200 employees, an average of 85 people are on-site, 130 on peak days, and around 15 percent of bookings remain unused. This allows you to make a well-founded decision on whether to plan for peak capacity or to smooth out peak days through team days and automatic release via check-in. The desk-sharing ratio is calculated by dividing booked desks by bookable desks.
Last updated:
2026-11-12